You know we have the solar panels and we haven’t paid an electric bill in months . . probably since February. We did eat a bit into our credit this month but we still are probably not going to owe anything for the foreseeable future. We’re supposed to be “net user”, meaning we use more than we send back on an annual basis. For some reason, this year, it isn’t going to happen. I asked Vince what happens if we end up being a net producer. He doesn’t know. Hopefully, it’s a slap on the wrist and “don’t do it again”.
The other day Vince suggested we turn the a/c way down and put on jackets. We didn’t but our company sends out a weekly report of how we’re doing on our energy use, compared to other homes in our area.

This is a little comical in and of itself because:
- We probably have about the smallest house in our area but we have the sewing room, and the a/c runs all the time in there because of Boots and the freeze dryer.
- We have 3 big freezers going and 3 fridges running.
- Over half the people in our area are older . . much older, and I doubt many of them keep their thermostat on 67 at night and 71 during the day.
We do have gas water heater, gas dryer, gas stove and gas furnace so . . are they comparing us to an all electric house??
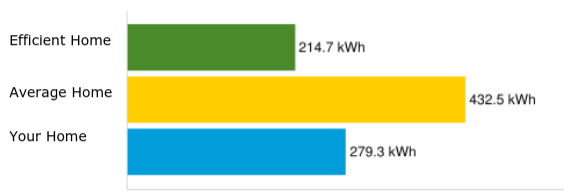
But, according to them, an energy efficient home would have used 214.7 kWh last week, the average house used 432.5 and we used 279.3. What they’re not taking into account is that we probably used 300 or 400 kWh from the solar panels because it has been HOT and our a/c has run constantly and it’s DRY so the well pump is running constantly to water the fruit trees around the house. The orchard is watered off the solar powered well.
So . . what good is the chart? Not much! I suppose it would be way more useful if we were comparing an energy efficient all electric 2,500 square foot house to another energy efficient all electric 2,500 square foot house. Or, even the same size energy efficient house to a non-energy efficient house, just for comparison but not knowing the size, the number of people in the home, if there’s gas, if there’s a well . . it just isn’t very useful info but it’s there and I look at it every week. It’s kinda funny . .

Bon says
Sounds like the solar panels are working out great
Diane Russell says
We get those stupid charts on the gas bill. I agree with you whole heartily. I bake bread almost every other day. Some of the bread takes an hour to bake.do the other homes do this? And who are the people in these super effluent homes? Most people I know do go in and out the house several times a day, either cold air to warm air comes in the door. So I just laugh and pay the bill.
Maggie says
I always wondered about those charts as well, because we are always home, and I wonder if some of those houses are empty all day, with thermostats programmed to turn on the heat or ac just before they come home.
dezertsuz says
I never thought about that, but I took my bill which gives me the kWh per billing period, 32 days for mid June to mid July, and my use was up from the previous two months because heat and humidity started being high. Divding the number by the days and multiplying by 7 gave me 208 for a week – and I do have an all electric house, and I keep the A/C at 74 at night and 77 in the day time. So, nice to know I’m energy efficient. LOL If anyone would have asked, I’d have said my home is NOT energy efficient because the weather stripping on both outside doors is in terrible condition and I need to replace it, but there you go.
Nelle Coursey says
Yesterday I got our “estimated bill” with 13 days left on it. It will be between $260 and $280!! We got a new gas meter today and I never knew the gas was off until the Atmos man came to light the hot water heater!! LOL. The water coming out of the tap is hot, hotter and hottest!! LOL